Addon for:
Skada Damage Meter.
Skada Damage Meter.
Pictures
File Info
| Updated: | 08-19-16 12:01 PM |
| Created: | 08-12-11 07:12 PM |
| Downloads: | 5,282 |
| Favorites: | 19 |
| MD5: |
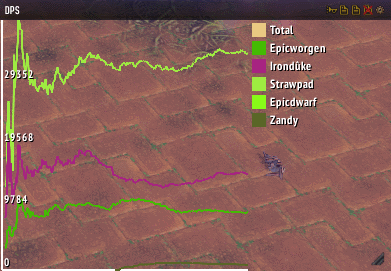
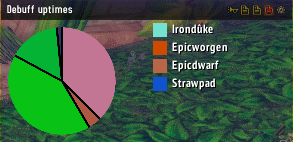
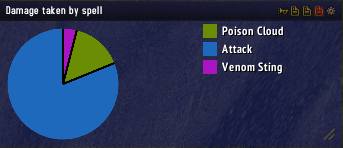
Skada Graphs 

 |
Comment Options |
 11-29-11, 09:55 PM
|
|
|
A Defias Bandit

Forum posts: 3
File comments: 2
Uploads: 0
|
__________________
don't worry about the world ending today, its always tomorrow on the other side of the word. 
|

|

|
|
08-17-11, 06:29 AM
|
|
|
A Kobold Labourer
Forum posts: 0
File comments: 45
Uploads: 1
|
|
|
|
|

|
08-16-11, 11:15 AM
|
|
|
A Murloc Raider
Forum posts: 5
File comments: 78
Uploads: 7
|
|
|
|
|
|
08-16-11, 04:06 AM
|
|
|
A Kobold Labourer
Forum posts: 0
File comments: 45
Uploads: 1
|
|
|
|
|
|
08-15-11, 04:47 AM
|
|
|
A Deviate Faerie Dragon
Forum posts: 13
File comments: 55
Uploads: 1
|
__________________
Never let me down again |
|
|
|
|
08-13-11, 10:49 AM
|
|
|
A Cyclonian
Forum posts: 44
File comments: 99
Uploads: 2
|
Last edited by Arxae : 08-13-11 at 01:50 PM.
|
|
|
|

|
08-13-11, 10:04 AM
|
|
|
A Murloc Raider
Forum posts: 5
File comments: 78
Uploads: 7
|
|
|
|
|
|
08-13-11, 10:03 AM
|
|
|
A Cyclonian
Forum posts: 44
File comments: 99
Uploads: 2
|
|
|
|
|
|
Support AddOn Development!
You have just downloaded by the author . If you like this AddOn why not consider supporting the author? This author has set up a donation account. Donations ensure that authors can continue to develop useful tools for everyone.